
Newert

Biosignal data platform

Turn scattered experiment data into a research asset.

A cloud research platform that stores biosignal data in a standard structure and lets you search, manage, analyze, and share it by experiment.
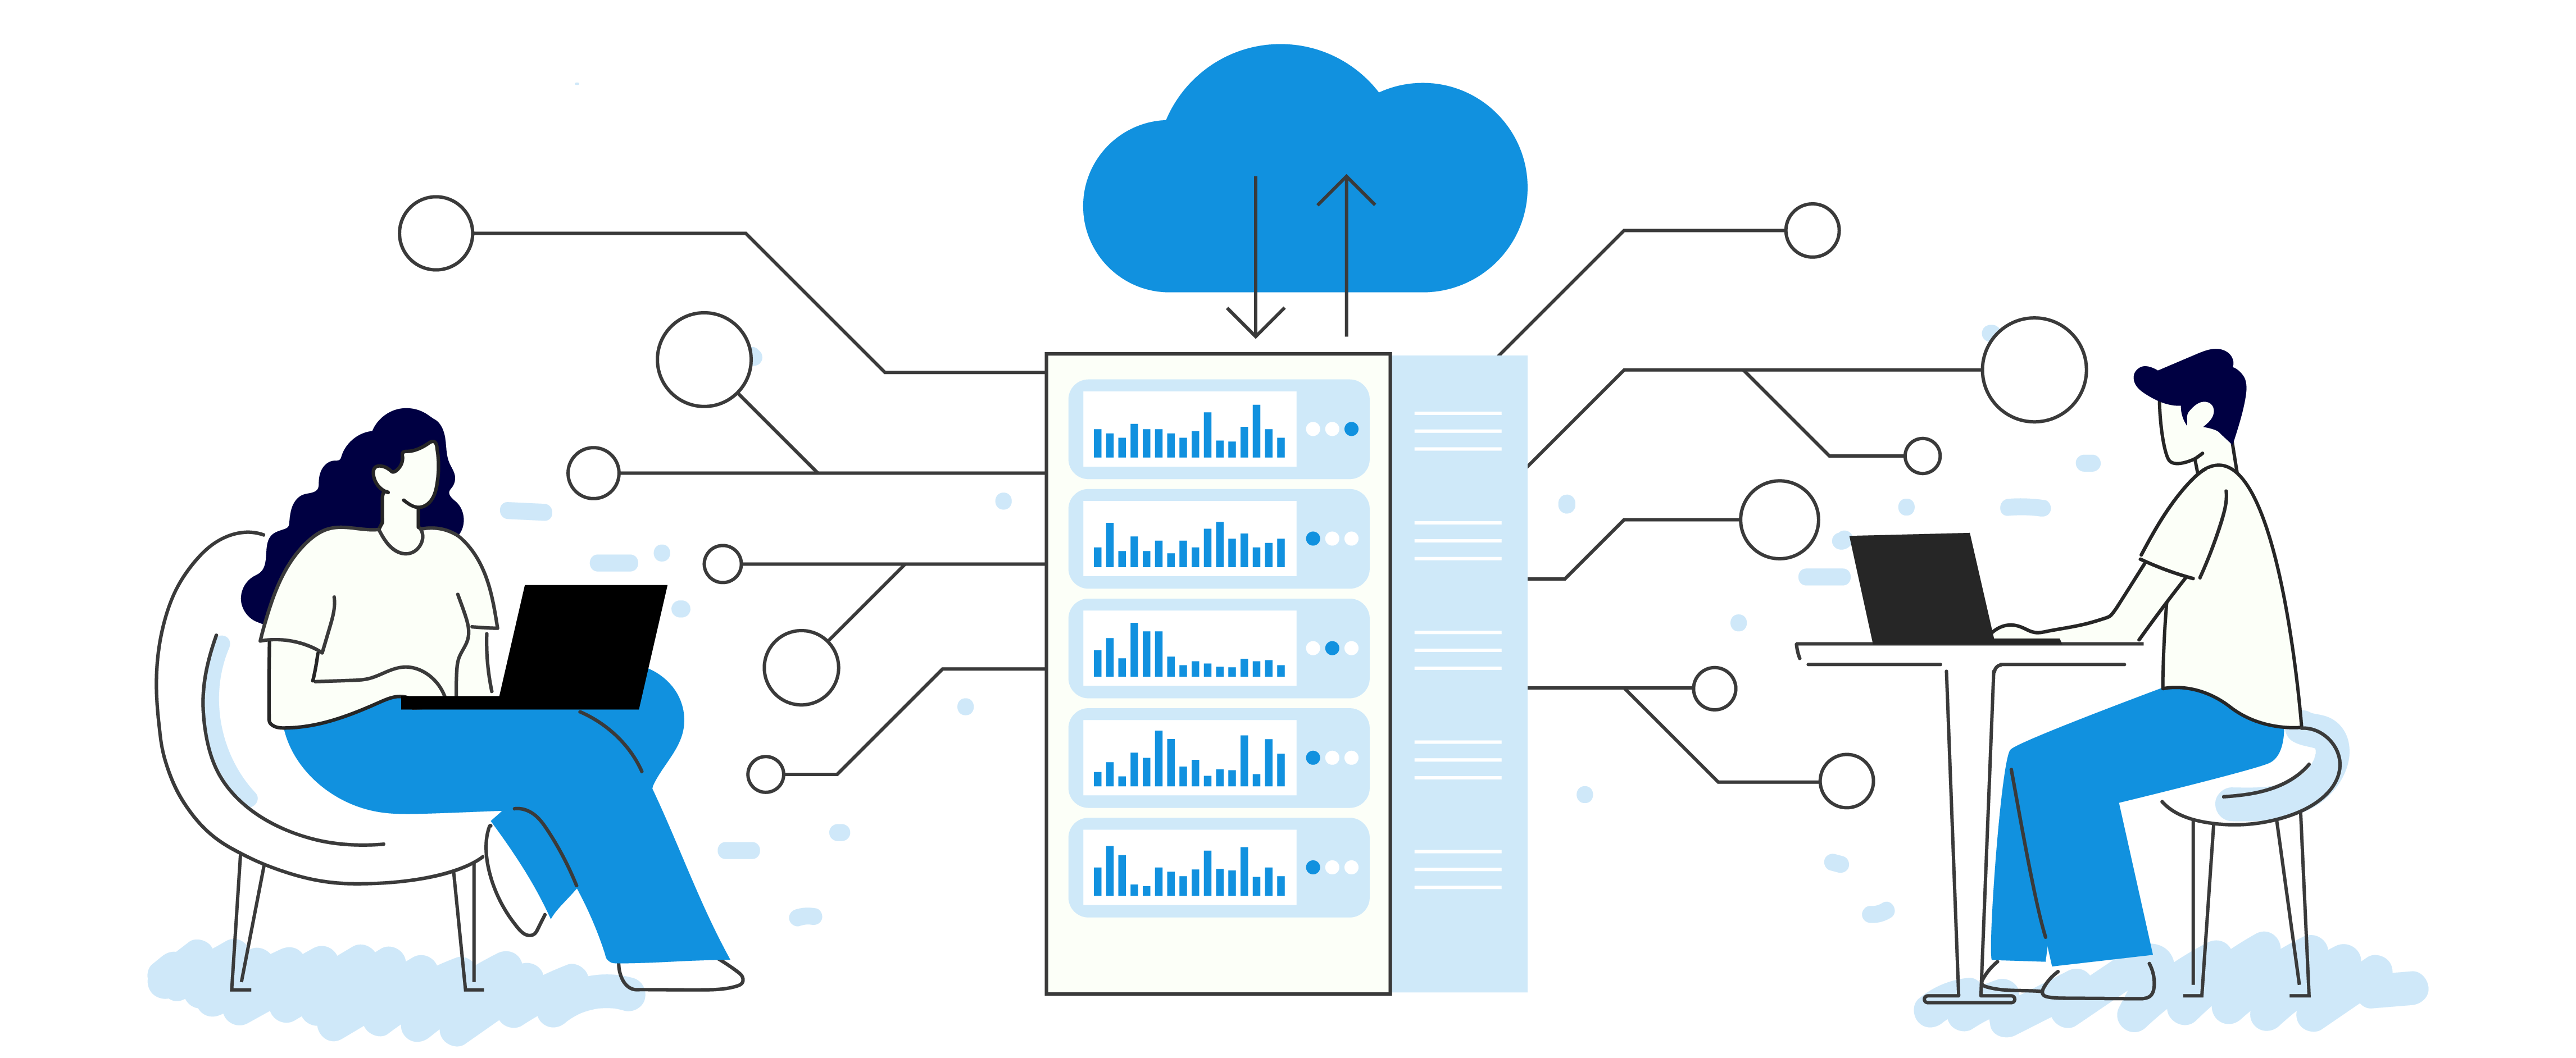
Biosignal Datahub platform screen

03Store

One data flow, from collection to sharing

Experiment data is managed consistently so that structure and analytical context survive a change of researcher

  1. 01

    Collect

    Upload data from measurement devices and existing files.

  2. 02

    Standardize

    Organize experiment, participant, and signal information into a common structure.

  3. 03

    Search

    Find the datasets you need by condition and metadata.

  4. 04

    Analyze

    Examine the character of your data through biomarkers and visualization.

  5. 05

    Share

    Research teams and partner organizations work from the same data context.

Only the screens you need to find and understand data

Search results and data summaries are kept separate, so you can judge what matters even in large datasets

Condition-based data search and review
Visualization and summary of collected data

Three steps and your first experiment is up

Sign up, create an experiment, upload the files — the summary is built for you
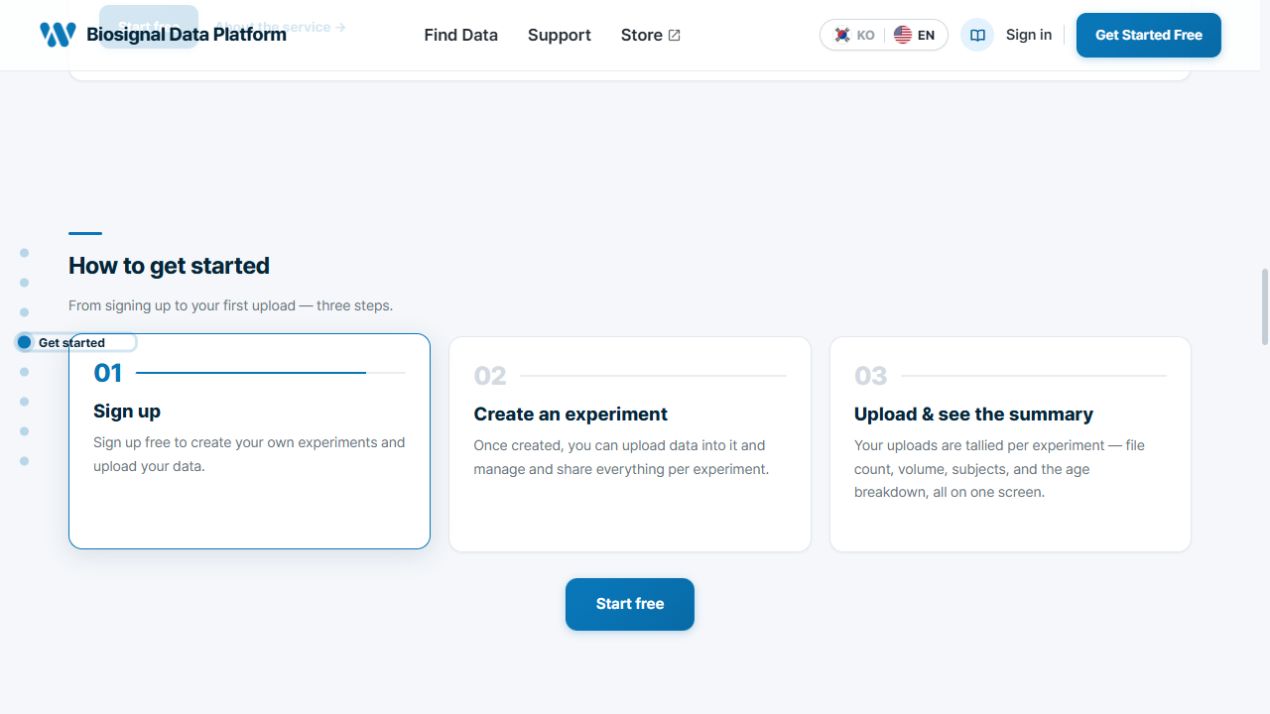
Datahub screen showing the three steps: sign up, create an experiment, upload and check the summary
Creating the experiment first keeps measurement conditions and participant details attached to the files. Most of what you need to trace a result back is decided at this step.

Event-based data management

Build data by measurement event and compare like with like

Separate baseline, task, stimulus, recovery, and other changes in measurement purpose into events, then connect participants, sessions, and signal files to each event.

Experiment structure

One experiment, multiple measurement events

Example structure
  1. 01

    Baseline measurement

    Baseline

    Record the reference state before a task or stimulus as its own event.

    • Participant code
    • PPG · IMU
    • Session record
  2. 02

    Task or stimulus

    Task / Stimulus

    Separate activity, stimulus, and protocol phases when their analytical conditions differ.

    • Study condition
    • Event order
    • Signal files
  3. 03

    Recovery or follow-up

    Recovery / Follow-up

    Keep post-task recovery and repeated measurements connected within the same experiment.

    • Session number
    • Time point
    • Analysis result

Compare the same event

Bring together matching conditions, such as baseline or the same task phase, across multiple participants.

Track change over sessions

Connect repeated and follow-up events in time order to examine individual or group change.

Trace results to conditions

Return from an analysis result to its participant, event, device, and source file.

Keep the research context, not just the files

Structure who was measured, under which conditions and with which signals so the dataset remains understandable when team members change

Experiment
Research objective, protocol, recording date and owner
Participant
Participant attributes and coded identifiers required for analysis
Signal
Signal type, channels, units, sampling conditions and equipment
Conditions
Cohort, session, stimulus and events used to interpret results

If your research gets harder as the data piles up

See the data structure and collaboration flow for yourself in Biosignal Datahub.

Go to the platform