
STEP 01
Find and connect a nearby EEG device
Scan for a nearby VitalTrack EEG, confirm the connection, channel count and incoming data, then continue to measurement setup.
Biosignal Measurement Board
Planned for release in 2026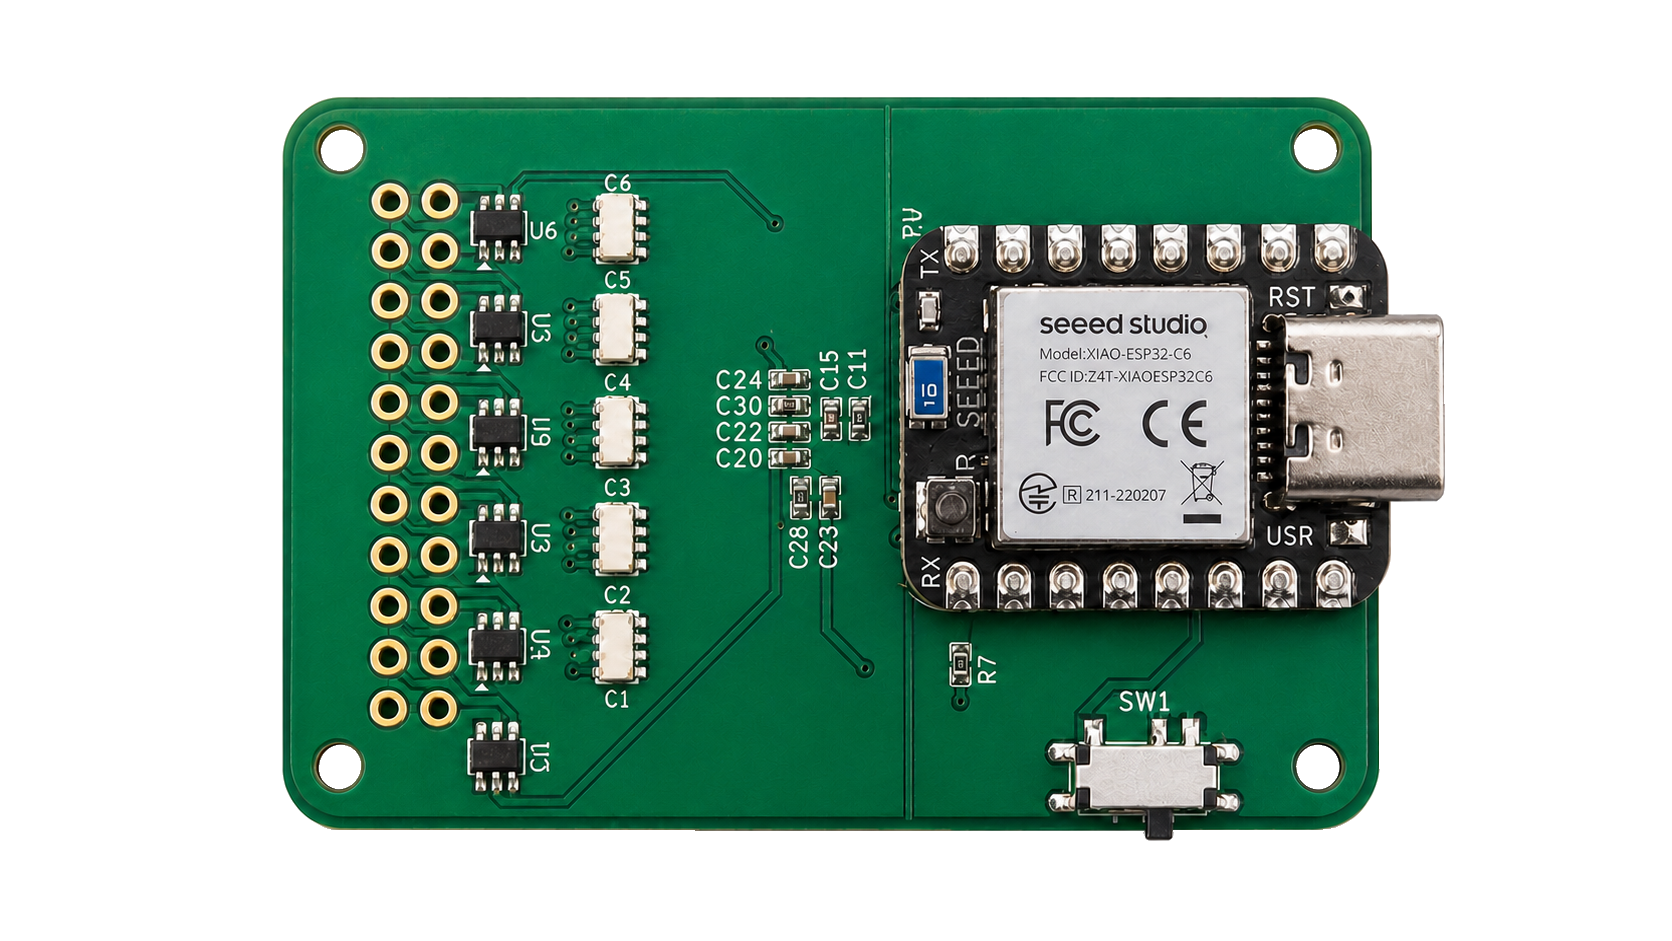
Confirmed specifications
* These three are confirmed. Sampling rate, battery life and the rest will be filled in once settled.
VitalTrack EEG hardware
This image shows the front and hardware layout of the VitalTrack EEG development board.
Measurement setup
Before recording, connect a nearby device and assign an electrode site to each physical channel. Confirm the connection and channel map, then continue to live measurement.
Scan for a nearby VitalTrack EEG, confirm the connection, channel count and incoming data, then continue to measurement setup.
Assign Fp1, Fp2, C3, C4, P3, P4, O1 and O2 to the physical channels using the international 10–20 placement system.
EEG distribution analysis preview
Without connecting a device, use SYNTHETIC / DEMO data to review scalp distribution, the channel-by-frequency PSD heatmap, and the publication-ready PNG produced by the application.
APPLICATION VIEW
Compare relative scalp band power with an eight-channel, 0.5–45 Hz PSD heatmap calculated from the latest eight seconds.
The current Alpha-band DEMO screen inspected directly in VitalTrack. It is not a human EEG measurement.
SAVED OUTPUT
The save action creates a high-resolution PNG and a matching JSON metadata file under Documents/VitalTrack/eeg_recordings/figures on Windows.
A 2400×2400 Beta relative-band-power PNG saved directly from the application, including the SYNTHETIC / DEMO watermark, sensor labels, and color range.
The screen and saved files use an eight-channel SYNTHETIC / DEMO example with stronger posterior Alpha. They are not human recordings and must not be used for medical diagnosis or interpreted as actual source localization.
Live monitoring
See each channel alongside receive rate, elapsed time and data status. Adjust the time window, amplitude, visible channels and display filter for the measurement environment.
EEG analysis
The application displays raw EEG alongside Delta, Theta, Alpha, Beta and Gamma band power. Because the raw signal remains available, researchers can also recompute and verify the frequency analysis with their own workflow.
CHANNEL BAND POWER
Review Delta, Theta, Alpha, Beta and Gamma band power as relative percentages or absolute strength to compare the frequency profile of each channel.
TOPOGRAPHY & PSD
View the spatial distribution of the selected band on a scalp map and compare it with a channel-by-frequency PSD heatmap.
Delta
0.5–4 Hz
Strongest during deep sleep.
Theta
4–8 Hz
Rises with drowsiness and memory work.
Alpha
8–13 Hz
Clearest at rest with the eyes closed.
Beta
13–30 Hz
Rises with alert concentration.
Gamma
30–45 Hz
Appears when several regions work at once.
The DEMO distribution view and PNG export were verified directly in the current application. Channel setup and live measurement after device connection could not be rechecked in this environment and may change before release.
Getting the data out
One column per channel, all eight. Values before filtering, so your existing handling still applies.
Review Delta, Theta, Alpha, Beta and Gamma per channel in the app as relative percentages or absolute strength. The verified session CSV does not contain band-power columns.
Each recording stores UTC time, elapsed time, device sample index, eight raw-channel values in µV and an event-marker column for use in Excel, Python or MATLAB.
LAUNCH UPDATES
Leave your email and we will contact you once the VitalTrack EEG launch and official availability schedule are confirmed.